Valid CSV, Wrong Total: The Housing Data Aggregation Trap
A reproducible Python guard for national benchmarks, regional groups and unmapped records
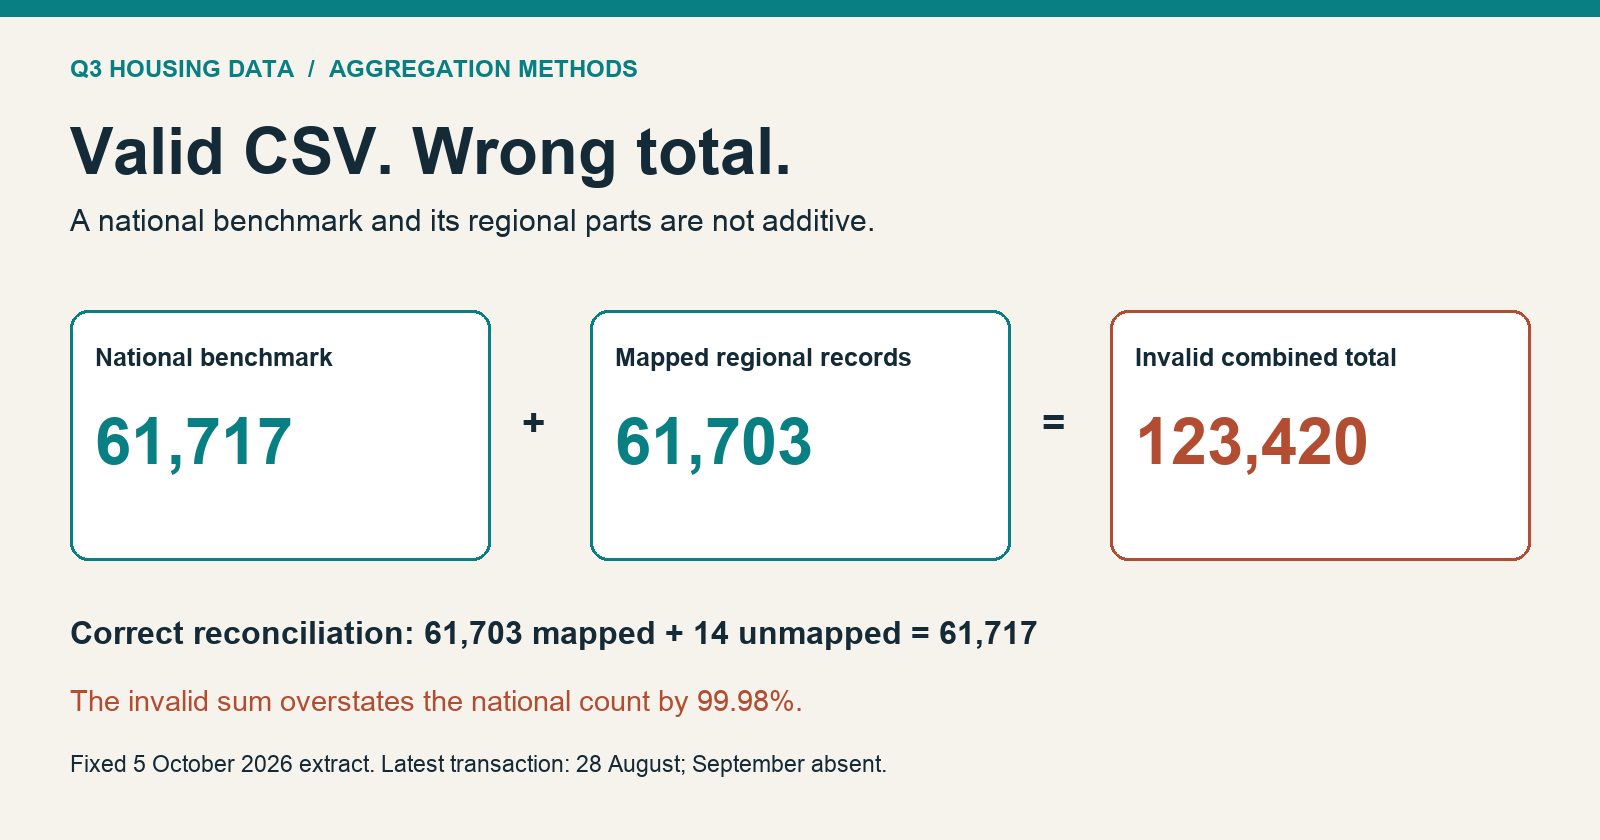
A housing table can have valid numbers, unique row keys and correct regional subtotals, yet still produce a national total that is almost twice as large as it should be. The problem is the level of aggregation: one row describes the whole population while the next seven describe parts of it.
The fixed Construction Capital Q3 2026 sales extract supplies a useful worked example. Its England and Wales row contains 61,717 recorded transactions. The seven regional groups contain 61,703 between them. A sum across all eight rows gives 123,420, an overstatement of 61,703 records, or 99.98%, relative to the national row.
That is a deliberately demonstrated bad calculation, not an error found in HM Land Registry's published national statistics. The source table contains both levels for comparison. This article turns that interpretation rule into executable checks, with a 15-quarter audit and small failure tests that other analysts can inspect.
Matt Lenzie / Construction Capital. Construction Capital is the commercial publisher of this research and a property-finance brokerage. The article and code use the existing public aggregate release; they are not an independent audit or a new transaction dataset.
Eight valid rows, one invalid sum
The Q3 housing sales dataset on Kaggle contains 120 geography-quarter rows: 15 quarters, each with one England and Wales benchmark and seven publisher-defined regional groups. These are not the standard nine English regions. London and South East, for example, are grouped together; Wales is included separately.
For the provisional Q3 2026 extract, the hierarchy is:
| Selection | Recorded transactions | Meaning |
|---|---|---|
| England and Wales benchmark | 61,717 | All records in the selected national extract |
| Seven regional groups combined | 61,703 | Records mapped into those groups |
| Unmapped residual | 14 | National records outside the mapped regional rows |
| Benchmark plus regional rows | 123,420 | Invalid total: mapped records counted twice |
The useful reconciliation is 61,703 + 14 = 61,717. It is not 61,717 + 61,703. The residual belongs beside the regional sum, rather than being silently dropped or spread proportionately across regions.
A uniqueness test on (quarter, geography) will pass for all eight source rows. So will an integer-type test. Neither checks whether two differently labelled rows describe overlapping populations. The failure happens after import, when a chart, pivot table or query treats every row as an additive observation.
Declare the geography contract before summing
For this fixed release, the contract names the national benchmark and all seven regional groups. It also fixes the expected quarters. Unknown names cause an error instead of being assigned to a region by a guess.
The core guard uses three conditions before adding the transaction counts:
- The selection contains one quarter.
- Every row belongs to the same declared geographical level.
- No quarter-geography key occurs twice.
Here is the central function. The downloadable module includes scope(), the explicit geography sets and a strict non-negative integer parser.
def sum_compatible(rows):
    if not rows:
        raise ValueError("Empty selection")
    if len({r["quarter"] for r in rows}) != 1:
        raise ValueError("Mixed quarters")
    if len({scope(r["geography"]) for r in rows}) != 1:
        raise ValueError("Mixed national and regional levels")
    keys = [(r["quarter"], r["geography"]) for r in rows]
    if len(set(keys)) != len(keys):
        raise ValueError("Duplicate quarter/geography key")
    return sum(count(r["transactions_recorded"]) for r in rows)
Selecting the national row returns 61,717. Selecting all seven regional rows returns 61,703. Passing all eight rows raises an error. Passing all national rows across 15 quarters also raises an error: a quarterly function should not quietly turn into a multi-year total.
This is a deliberately narrow contract. It does not claim that any two rows labelled “regional” are disjoint. Their compatibility comes from the declared source mapping. In another dataset, a city and its surrounding region may overlap even if the column gives both the same generic type. That dataset needs a different hierarchy and explicit membership rules.
Reconcile the residual instead of forcing equality
Requiring the seven regions to equal the national count exactly would reject this legitimate release. The mapping coverage table already explains why they differ.
The full audit checks that there is exactly one row for every declared geography-quarter combination, and one coverage record for each quarter. For every period, it verifies:
national sales row = coverage national count
sum of regional sales rows = coverage mapped count
national count = mapped count + unmapped count
All 15 quarters from 2023 Q1 to 2026 Q3 reconcile under those rules. The output records the national count, mapped count, residual, unsafe sum and resulting overstatement for each quarter. The original inputs remain unchanged.
The same mistake is visible in the previous year's Q3: 210,888 national records plus 210,836 mapped records produce an invalid 421,724. A plausible-looking growth chart would not necessarily expose this problem. Similar double counting in both periods can leave a growth rate looking roughly reasonable while the levels are wrong.
This is why checking only a headline percentage is a weak safeguard. Reconcile the underlying counts before calculating a change.
Run it, then make it fail
The public aggregation guard and backing files include the unchanged 120-row sales table, the 15-row coverage table, a standard-library Python module, tests, an output CSV, a data dictionary and source hashes. There are no account credentials or row-level property addresses in the package.
Download the repository and run these commands from audits/aggregation-levels:
python3 aggregation_guard.py --output reproduced
python3 -m unittest -v test_guard.py
The tests cover valid national and regional selections, plus deliberate failures for mixed levels, mixed quarters, duplicate keys, a missing regional row, an unexplained residual, an undeclared geography, invalid counts and an empty selection. All 11 tests passed on 28 October 2026. Several invalid numeric inputs are tested within one test method.
These failures matter because the dangerous operation is often downstream of the original release. A dashboard user can select “all geographies”; a join can duplicate a row; a new file can omit one group. The source may remain intact while the consumer creates a misleading aggregate.
The tests do not prove that every possible bad transformation will fail. They make the intended boundary visible and exercise specific mistakes. Python's CSV documentation explains the parsing interface; deciding which records may be added remains the analyst's responsibility.
Put safe selections into the reporting layer
A practical reporting model can expose two views: a national benchmark view and a regional view. Keep the unmapped residual in a reconciliation table. Label the regional sum as mapped records, and disable a grand total that combines it with the benchmark.
Where a tool requires a flat table, retain a visible geographical-level field and constrain each chart to one level. Do not rely on users remembering an exclusion hidden in a caption. Run the contract after each refresh, before generating summaries or publishing exports.
Keep medians out of this additive path altogether. A count can be added across disjoint groups; regional medians cannot be summed or averaged into the national median. The function intentionally accepts only the transaction-count field.
What this means for a development appraisal
Correct aggregation protects the scale of the evidence. It does not make the extract complete. This fixed edition was assembled on 5 October 2026, and its latest recorded transaction date is 28 August. September transactions are absent. No part of this calculation estimates final Q3 volumes or the percentage of transactions still missing.
HM Land Registry's Price Paid Data guidance explains the difference between a sale occurring and its registration appearing in the data. A clean mapping reconciliation cannot resolve that timing gap.
The Construction Capital London and South East Q3 report provides the related regional context. For a Development Finance appraisal, transaction evidence can inform the questions asked about an exit market, but these aggregate counts cannot establish a scheme's value, achievable selling price or sales timetable.
The operational rule is small enough to put into code: select a compatible population, preserve its residuals, and only then calculate. A CSV parser can confirm that a file is readable. The reporting model must define what its numbers mean.
Data attribution: Contains HM Land Registry Price Paid Data, Crown copyright and database right 2026, available under the Open Government Licence v3.0. Original explanation and derived audit: Matt Lenzie / Construction Capital, CC BY 4.0. Code: MIT. This supporting methods adaptation uses study CC-DF-2026Q3-03 and does not add an independent study.
Comments
Join the discussionNo comments yet. Be the first to comment.